Formula 1 in Numbers: An Exhaustive Analysis of the Pinnacle of Motorsport
Formula 1 in numbers


Introduction
The spectacle of a Formula 1 Grand Prix is a symphony of extremes. It is the visceral scream of a power unit at 15,000 RPM, the blur of carbon fibre slicing through the air at over 350 km/h, and the scent of hot rubber and ionized air. For the millions who watch, it is a sensory overload, a high-speed drama played out on the world's most demanding circuits. Yet, beneath this raw, tangible experience lies a silent, invisible world governed by a force more powerful than any engine: numbers. From the thousandth of a second that separates pole position from second place, to the terabytes of data transmitted from car to factory on every lap, Formula 1 is a sport defined, driven, and decided by data.
This report delves beneath the surface spectacle to quantify the world of Formula 1. It dissects the sport through four critical numerical lenses: the machine, an engineering marvel pushed to the very edge of physics; the human athlete, a biological component enduring stresses comparable to fighter pilots and marathon runners simultaneously; the global business, a multi-billion dollar enterprise with a complex financial ecosystem; and the data itself, the digital nervous system that binds them all. By analyzing these numbers, both in the present and across the sport's 75-year history, this analysis reveals the complex, interconnected systems that define the pinnacle of motorsport.
Section 1: The Anatomy of a Modern Marvel: Deconstructing the F1 Car
A modern Formula 1 car is one of the most technologically advanced and complex pieces of sporting equipment on Earth. It is a convergence of aerospace engineering, material science, and computational power, all designed with a singular purpose: to conquer time. To understand its capabilities, one must first understand the staggering numbers that define its very existence.
1.1 The Price of Performance: A Multi-Million Dollar Machine
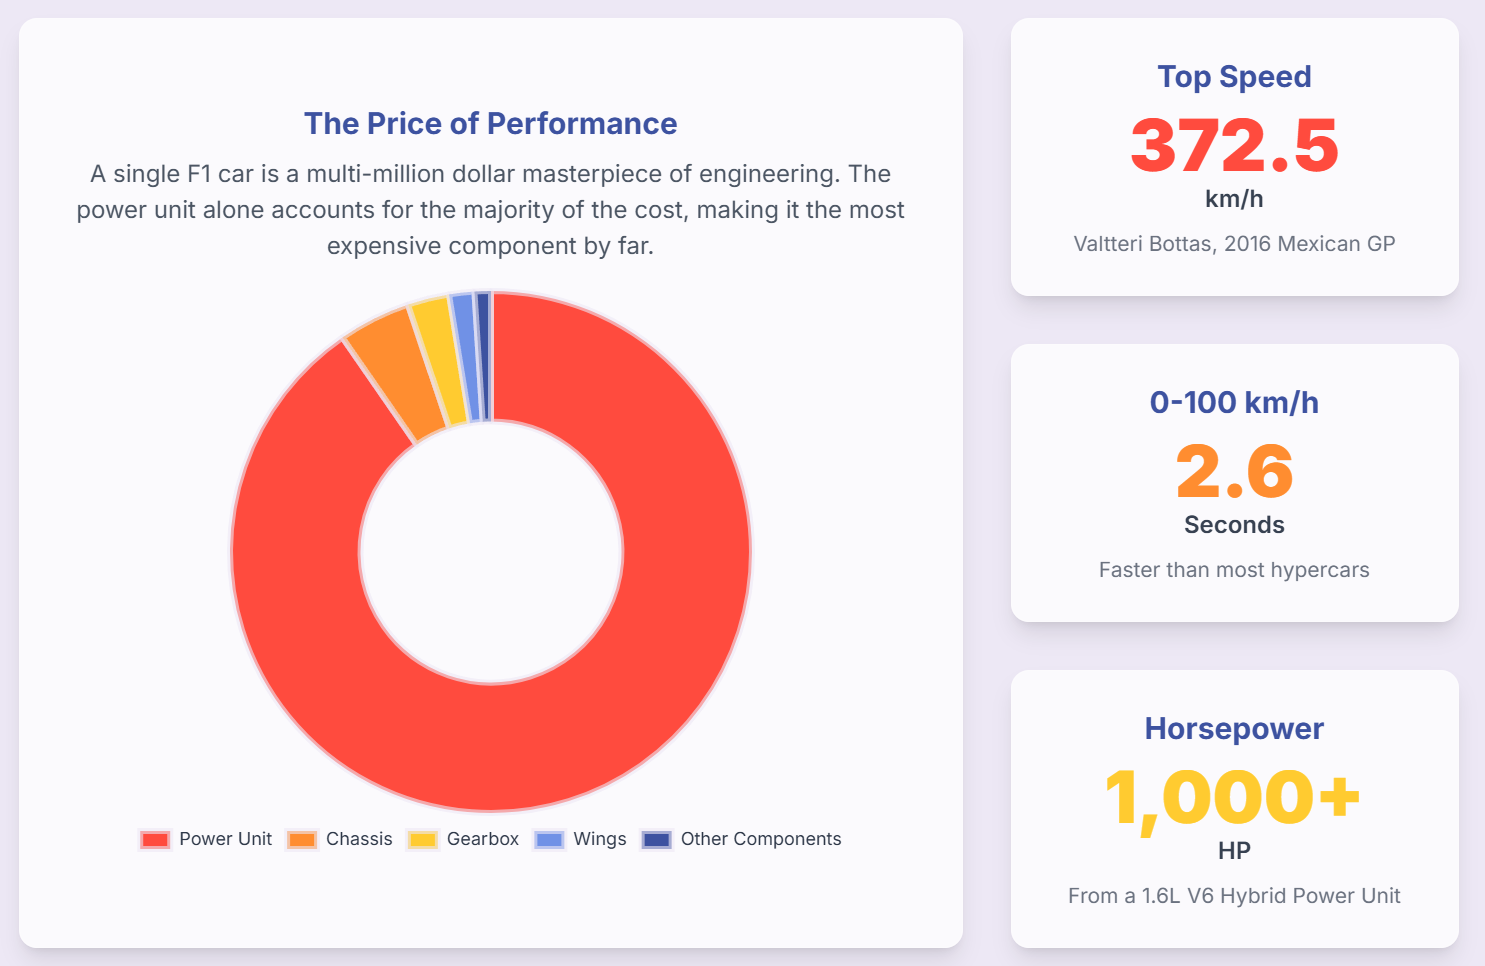
The cost of designing, manufacturing, and assembling a single Formula 1 car is a monumental investment. While teams are famously secretive about precise figures, industry estimates place the build cost of one car between $12 million and $20 million.This figure represents only the physical components and assembly, and does not account for the hundreds of millions of dollars that were historically spent on research and development before the introduction of the sport's cost cap. The power unit is, by a significant margin, the most expensive part of the car, with estimates for its cost ranging from $10.5 million to as high as $16.25 million, constituting the vast majority of the vehicle's total value.The other components, while less expensive, are still feats of bespoke engineering with price tags to match.
The financial framework of the sport has fundamentally reshaped the engineering philosophy of the teams. The cost of the physical car, while enormous, represents only a fraction—roughly 12%—of a team's total performance-related budget cap of $135 million.The remaining 88% is allocated to the "unseen" aspects of performance: salaries for hundreds of engineers and designers, the immense computational cost of Computational Fluid Dynamics (CFD) and other simulations, wind tunnel testing, and the vast data analysis infrastructure required to compete.This reality reveals that the budget cap's primary function is not to limit the cost of the physical car itself, but to curtail the previously limitless "arms race" in research, development, and intellectual horsepower. It forces teams to be ruthlessly efficient with their computational and human resources, underscoring that modern F1 championships are won in the data center and the simulator just as much as on the assembly line.
Table 1: Estimated F1 Car Component Cost Breakdown
Component | Estimated Cost (USD) | Source(s) |
Power Unit | $10,500,000 - $16,250,000 | |
Chassis (Monocoque) | $629,000 - $700,000 | |
Gearbox | $314,000 - $450,000 | |
Front Wing & Nose Cone | ~$126,000 - $150,000 | |
Rear Wing & DRS | ~$75,000 - $136,000 | |
Steering Wheel | $44,000 - $50,000 | |
Halo Safety Device | $15,000 - $17,000 | |
Set of 4 Tires | ~$2,700 |
1.2 The Heart of the Beast: The Power Unit in Detail
The term "engine" is insufficient for the power source of a modern F1 car. It is a "power unit," a highly complex hybrid system that represents a marvel of efficiency and power density.At its core is a 1.6-litre V6 turbocharged internal combustion engine (ICE).Combined with its Energy Recovery Systems (ERS), the total power output is approximately 1,000 horsepower (hp).The ICE itself contributes around 840 hp, while the electric motors provide an additional boost of up to 120 kW, or 160 hp.
The operational limits are immense. The ICE has a regulatory maximum rotational speed of 15,000 RPM, a figure far beyond any road car.However, due to a mandated maximum fuel flow rate of 100 kg/hour above
10,500 RPM, the engine's effective power peak occurs at this lower speed.The hybrid side of the power unit consists of two motor-generator units (MGUs). The MGU-K (Kinetic) is coupled to the crankshaft, harvesting energy during braking and deploying it for acceleration. The MGU-H (Heat) is connected to the turbocharger, recovering waste heat energy from the exhaust gases. This MGU-H can spin at astonishing speeds of up to
125,000 RPM, almost ten times faster than the engine itself, eliminating turbo lag and dramatically improving efficiency.
1.3 The Physics of Speed: Quantifying Performance
The result of this advanced engineering is a vehicle with performance capabilities that defy conventional automotive standards.
- Acceleration: An F1 car can accelerate from 0 to 100 km/h (62 mph) in approximately 2.6 seconds.Perhaps more impressively, its acceleration at higher speeds is even more ferocious; the sprint from 100 km/h to 200 km/h takes under 2 seconds.The 0-300 km/h (186 mph) mark is reached in a blistering 8.4 seconds.
- Top Speed: While average speeds on a circuit are around 200 mph (322 km/h), the peak velocities are much higher.The official record for the highest speed achieved during a race belongs to Valtteri Bottas, who was clocked at 372.5 km/h (231.46 mph) at the 2016 Mexican Grand Prix.An even higher, albeit unofficial in a race context, speed of 378 km/h (234.9 mph) was recorded by Bottas during a qualifying session for the 2016 European Grand Prix in Baku, a track renowned for its long straight.
- G-Forces: The car's aerodynamic and mechanical grip generate forces that place immense strain on both the car and driver. Under braking, drivers experience deceleration forces of up to 6G, while high-speed corners can subject them to sustained lateral forces of 4-5G.
1.4 The Sum of Its Parts: A Study in Complexity
The sheer complexity of an F1 car is difficult to comprehend. Estimates for the total number of individual components that make up a single car vary widely, from a more recent figure of 14,500to an older estimate as high as 80,000.This discrepancy is not merely a statistical anomaly; it tells a story of regulatory evolution. The higher 80,000 figure dates to the dawn of the complex hybrid era in 2014, a time of peak bespoke engineering where teams designed nearly every nut and bolt. The lower 14,500 figure aligns with the modern era of cost caps and the introduction of "standard" and "prescribed" parts from 2022 onwards, which teams must either buy or build to a set design.This numerical shift reflects a genuine change in design philosophy, forced by financial regulations, moving the sport away from ultimate complexity towards a more optimized and cost-controlled engineering model. All these components must adhere to a strict minimum weight limit of 800 kg for the car, including the driver but excluding fuel.
Section 2: The Superhuman in the Cockpit: The Physicality of an F1 Driver
While the car is an engineering marvel, it is piloted by a human athlete subjected to some of the most extreme physical and physiological conditions in sport. The numbers behind a driver's race performance reveal that they are not merely steering a vehicle, but are an integral, performance-limiting biological component of the entire system.
2.1 Enduring the Extremes: The In-Cockpit Environment
The cockpit of an F1 car is a brutal environment. For the duration of a race, which can last up to two hours, drivers endure conditions that would incapacitate an ordinary person.
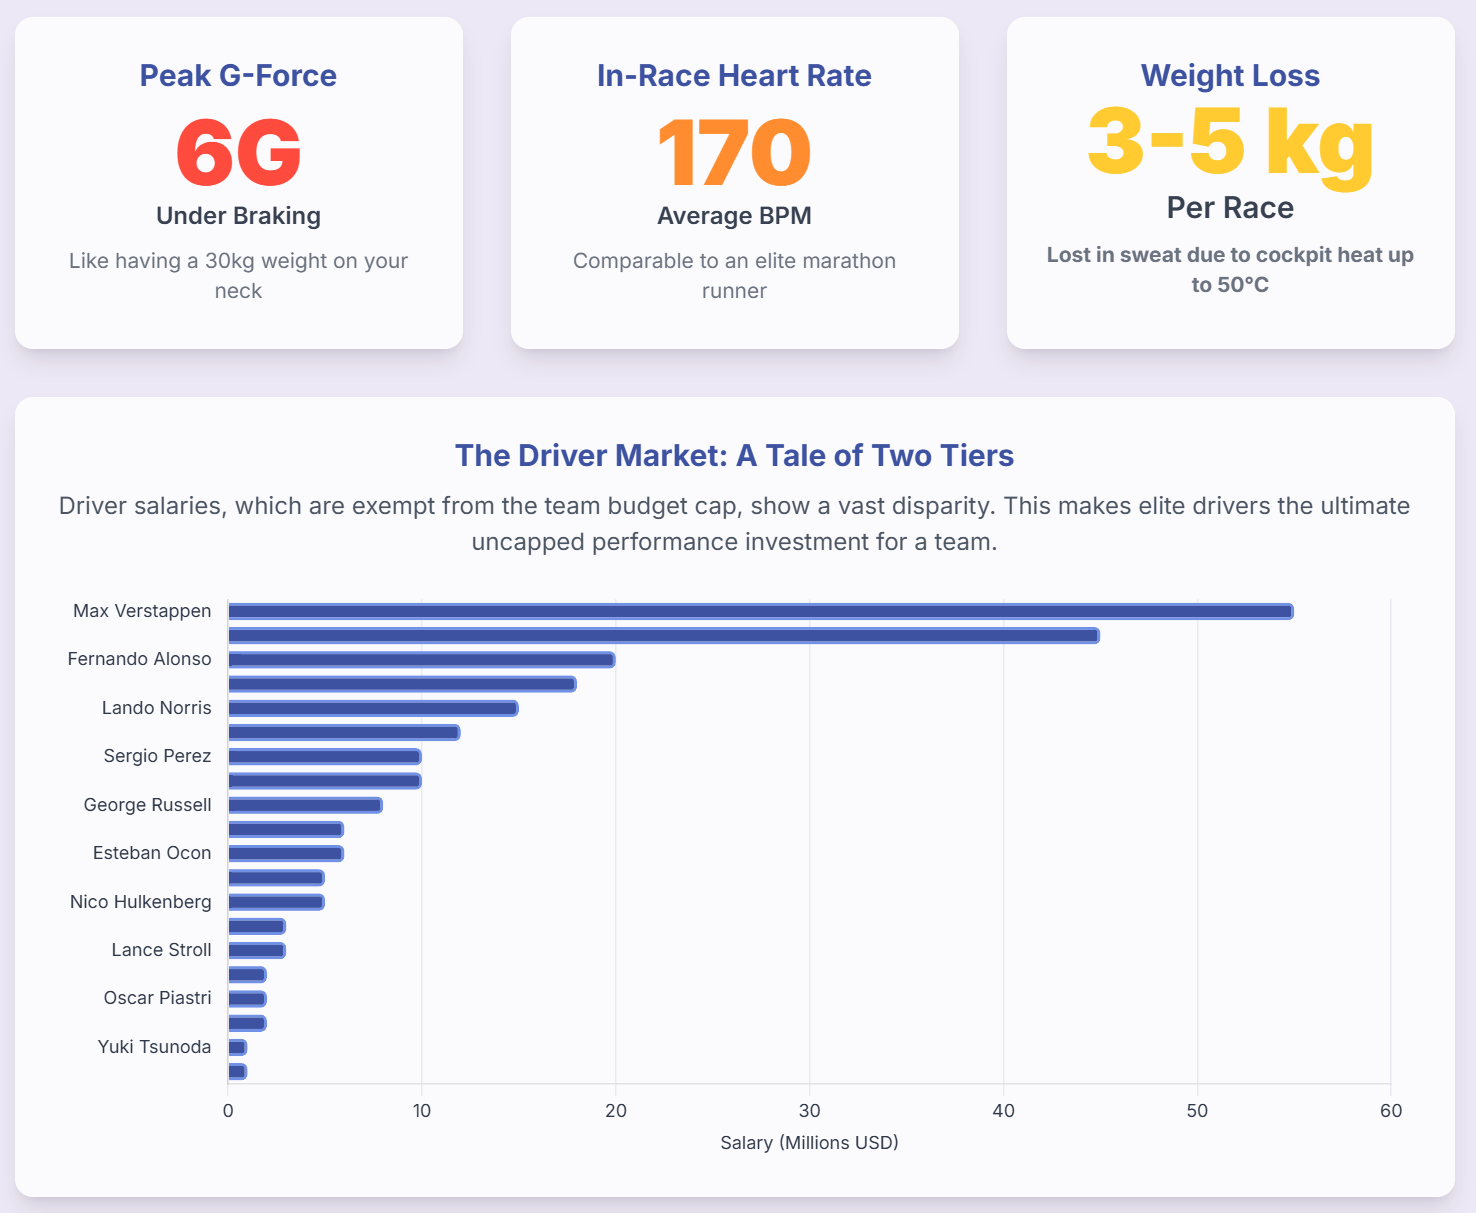
- G-Forces: In every braking zone and high-speed corner, drivers battle immense gravitational forces. They routinely withstand sustained lateral Gs of 4-5G and peak deceleration forces of up to 6G.To put this in perspective, a driver's head, which with a helmet weighs approximately 6-7 kg, exerts a force of over 25-30 kg on their neck muscles during a 5G corner.They must have the highly specialized neck and core strength to withstand these forces for hundreds of corners over a race distance.
- Extreme Heat: The cockpit is a cramped, enclosed space surrounded by hot machinery and electronics. Temperatures can soar to 50°C (122°F), often with high humidity, creating a sauna-like environment in which the driver is working at maximum physical exertion.
2.2 A Marathon at 300 km/h: Biometric Data
The strain of this environment is reflected in the drivers' biometric data, which is comparable to that of elite endurance athletes.
- Cardiovascular Strain: Throughout a Grand Prix, a driver's heart rate averages between 160 and 170 beats per minute (bpm).During intense moments, such as the race start, a wheel-to-wheel battle, or a critical qualifying lap, this can peak at over 200 bpm.This sustained cardiovascular load is similar to that experienced by a marathon runner, but with the added mental stress and physical load of G-forces.Their elite conditioning is evident in their resting heart rates, which are often as low as 40 bpm.
- Weight and Fluid Loss: The combination of extreme heat and physical exertion leads to intense perspiration. Drivers can lose between 3 and 5 kg (approximately 6.5 to 9 lbs) of body weight during a single hot race.This is almost entirely fluid loss, and even a small percentage of dehydration can lead to a significant drop in concentration and reaction time, making fluid management critical.
- Caloric Expenditure: The physical and mental effort required to pilot an F1 car for two hours is immense. It is estimated that a driver can burn up to 3,000 calories during a Grand Prix, highlighting the sheer energy required to perform at the elite level.
The extreme physical demands reframe the driver not just as a pilot, but as a critical biological component. The data on G-forces, heat, and cardiovascular load directly correlates to human performance limitations. Dehydration impairs cognitive function and reaction times, while muscular fatigue from G-forces diminishes a driver's ability to make the precise, delicate inputs required to control the car at the limit. Consequently, a driver's physical conditioning—their neck and core strength, cardiovascular endurance, and heat tolerance—is as crucial to consistent lap time as the car's aerodynamic efficiency or engine power. Teams invest heavily in their drivers' fitness not merely for their well-being, but because a physically superior driver can extract more performance from the car, especially in the grueling final stages of a race. The driver's body is a variable that must be optimized, just like tire pressure or wing angle.
2.3 The Value of Talent: The Driver Market
The unique and demanding skillset of an F1 driver commands significant financial reward, creating a market with a vast spectrum of earnings. The 2024 grid illustrates this disparity clearly. At the apex, three-time World Champion Max Verstappen earns a reported base salary of $55 million, with seven-time champion Lewis Hamilton close behind at $45 million.In contrast, drivers at the other end of the grid, such as Yuki Tsunoda and Logan Sargeant, earn a base salary of $1 million.This creates a staggering 55-fold difference between the highest and lowest-paid athletes in the sport. The total estimated salary bill for all 20 drivers on the 2024 grid is approximately $258 million.
This massive disparity in driver salaries is a direct and strategic consequence of the sport's financial regulations. The cost cap, set at $135 million, strictly limits what teams can spend on car development and performance, effectively leveling the playing field and preventing top teams from simply out-spending their rivals to build a faster car. However, driver salaries are explicitly excluded from this cap.This makes the driver the single most significant performance differentiator that a team can invest in without restriction. In this new regulatory environment, the pursuit and retention of a generational talent like Verstappen or Hamilton has become the most powerful financial and competitive weapon a team can wield. The "superstar economy" of F1 is the last great uncapped frontier of spending.
Section 3: The Global Spectacle: The Business and Logistics of Formula 1
Formula 1 is more than a collection of cars and drivers; it is a massive, mobile, global enterprise. The numbers that govern its structure, finances, and audience reveal a sport that has undergone explosive growth, transforming into one of the world's premier entertainment properties.
3.1 The World Championship Structure
The framework of the FIA Formula One World Championship has evolved significantly since its inception. A modern season features a record-breaking calendar of 24 races, a stark contrast to the mere 7 races held in the inaugural 1950 season.The standard distance for a Grand Prix is defined as the fewest number of laps required to exceed a total distance of 305 kilometres (approximately 190 miles).The only exception to this rule is the Monaco Grand Prix. Due to the tight, twisting nature of the street circuit and its consequently low average speed, its race distance is shortened to the fewest laps needed to exceed 260 km (160 miles) to ensure the event fits within the typical two-hour race window.
Points are the currency of the championship. For a full-length Grand Prix, points are awarded to the top ten finishers on a sliding scale: 25, 18, 15, 12, 10, 8, 6, 4, 2, and 1.In a move to add more competitive action to the weekend, six events on the calendar also host a "Sprint." This is a shorter, 100 km race that awards championship points to the top eight finishers: 8, 7, 6, 5, 4, 3, 2, and 1.
3.2 The Economics of Racing
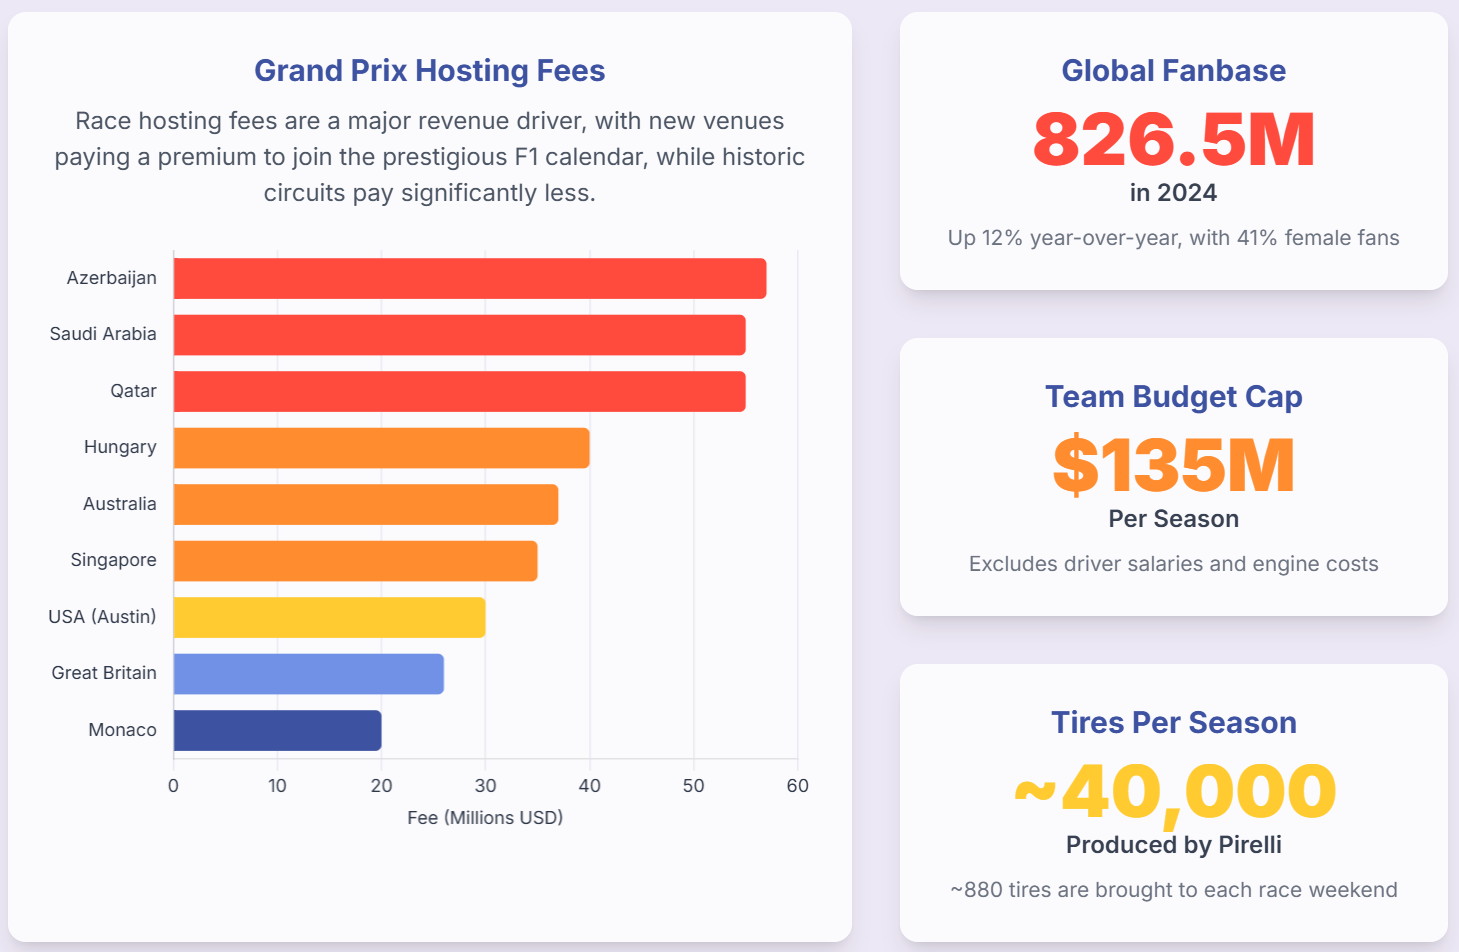
The financial engine of Formula 1 is as complex as its power units. Teams operate under a strict performance-related cost cap, which for the 2024 season was set at $135 million.This cap governs spending on anything related to car performance but excludes major line items such as driver salaries, the salaries of the three highest-paid personnel, and engine development costs.
On the revenue side for Formula 1 Group, hosting fees from race promoters are a primary income stream. These fees vary dramatically, revealing a two-tiered business model. Historic, prestigious circuits in the sport's European heartland, such as Monaco and Silverstone, pay relatively lower fees, in the range of $20 million to $26 million.In this relationship, the circuit's heritage provides prestige
to Formula 1. Conversely, newer venues, particularly those in the Middle East and other emerging markets, pay exorbitant fees to secure a place on the calendar. Countries like Azerbaijan, Saudi Arabia, and Qatar pay between $55 million and $57 million annually, using the global platform of F1 for tourism, investment, and nation-branding purposes.In this relationship, Formula 1 provides prestige
to the host nation. This dual strategy allows F1 to maintain its historic soul while simultaneously funding its aggressive growth through high-paying new markets. The total annual revenue from these hosting fees is estimated to be around $700 million.For the host cities, this investment can yield significant returns; the inaugural Las Vegas Grand Prix, for example, was estimated to generate a $1.2 billion economic impact for the local area.
Table 2: Estimated Grand Prix Hosting Fees (Selected Circuits)
Grand Prix | Estimated Annual Fee (USD) | Source(s) |
Azerbaijan GP (Baku) | $57 million | |
Saudi Arabian GP (Jeddah) | $55 million | |
Qatar GP (Losail) | $55 million | |
Hungarian GP (Hungaroring) | $40 million | |
Australian GP (Melbourne) | $37 million | |
Singapore GP (Marina Bay) | $35 million | |
US GP (Austin) | $30 million | |
British GP (Silverstone) | $26 million | |
Monaco GP (Monte Carlo) | ~$20 million |
3.3 A Global Following
Formula 1's popularity has soared in recent years, a boom that is quantifiable in its audience metrics. The sport's global fanbase grew by an impressive 12% in a single year to reach 826.5 million people in 2024.This growth has been fueled by a targeted content strategy, most notably the Netflix docuseries "Drive to Survive," which is credited with igniting interest in the United States.The data supports this, showing a 10.5% increase in the American fanbase to 52 million, and revealing that 1 in 2 US fans started following the sport in the last five years.
This "Drive to Survive effect" is also reshaping the sport's demographics. The fanbase is becoming younger and more diverse, with 42% of fans now under the age of 35, and 41% identifying as female—a notable increase from 37% in 2018.This new, engaged audience is turning out in record numbers. The 2024 season saw a total attendance of 6.5 million fans across all races, with four events—Australia, Great Britain, the United States (Austin), and Mexico—each welcoming over 400,000 spectators over the Grand Prix weekend.These numbers prove that the strategy of turning the sport's personalities and behind-the-scenes drama into compelling narrative content has been the single most important catalyst for F1's recent commercial success.
3.4 A Season on Rubber: The Tire Operation
The logistics of supplying tires for a global championship are immense. Pirelli, the sport's exclusive tire supplier, produces approximately 40,000 tires specifically for the Formula 1 season.For a standard Grand Prix weekend, each of the 20 drivers is allocated 13 sets of dry-weather "slick" tires, 4 sets of intermediate tires for damp conditions, and 3 sets of full wet tires for heavy rain.This amounts to 40 sets per team. Across the grid, this means an average of 880 individual tires are brought to each race. Over a 22-race season (as in 2022), this equates to a total of over 19,000 tires being used, a figure that doesn't include the thousands more used for dedicated testing sessions.After use, all tires are returned to Pirelli's factory for a comprehensive recycling process.
Section 4: The Data Deluge: F1's Digital Nervous System
In modern Formula 1, data is not just a part of the sport; it is the sport's lifeblood. It has evolved from a tool for analysis into the primary driver of performance, strategy, and decision-making. The sheer volume and velocity of this data have transformed F1 into a high-speed technology race.
4.1 A Terabyte per Weekend: The Scale of Data Generation
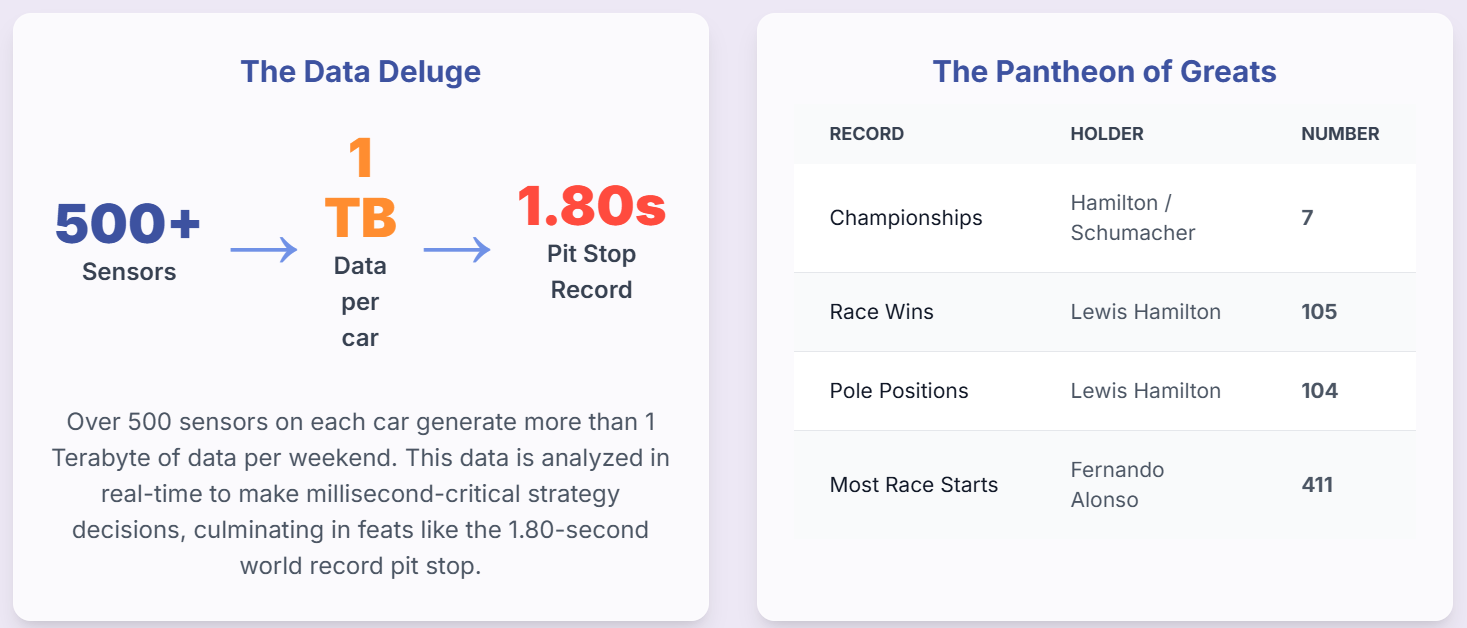
A single F1 car is a mobile, high-performance data center. It is equipped with a complex network of over 500 sensors, a figure that dwarfs the 30 sensors in a typical road car.These sensors—monitoring everything from engine temperature, tire pressure, and G-forces to the driver's biometric data—collect up to 10,000 individual data points every second.
This constant stream of information results in a staggering amount of data. Over a single race weekend, one car can generate over 1 terabyte (TB) of data, a figure that includes telemetry, high-definition video, and other ancillary information.The live telemetry feed transmitted from the car while it is on track amounts to roughly 30 megabytes per lap.
4.2 From Telemetry to Strategy: The Application of Data
This data is useless without the ability to transmit and analyze it in real time. Data is sent from the car's onboard antenna to the team's garage and simultaneously to its factory headquarters with minimal delay. For European races, the latency can be as low as 10 milliseconds. For "flyaway" races on other continents, like Australia, it is still an incredibly rapid 300 milliseconds.
This real-time feed allows teams to move beyond reactive problem-solving into the realm of predictive analytics. Using machine learning algorithms and powerful simulation software, teams run thousands of race scenarios based on the incoming data. They can forecast tire degradation with remarkable accuracy, predict optimal fuel consumption, and model the perfect window for a pit stop, turning strategy from a gut feeling into a data-driven science.The ultimate physical expression of this data-driven optimization is the pit stop. The current world record, a jaw-dropping 1.80-second tire change by McLaren, is not a feat of chance but the result of analyzing countless data points to choreograph the precise, synchronized movements of a 20-person crew.
4.3 The Unseen Race: The Remote Operations Hub
One of the most significant transformations driven by data is the location where the race is won. Many of the most critical strategic decisions are no longer made by the team principal on the pit wall, but by a large team of engineers in the "Race Support Room" or "Mission Control" at the team's factory, often thousands of miles away from the circuit.These remote hubs are equipped with supercomputers and are staffed by dozens of specialists who analyze the data deluge in greater depth than is possible at the track. They run complex simulations and communicate their findings and strategic recommendations back to the trackside team, influencing everything from tire choice to engine mode adjustments.
This reality means that a modern F1 victory is the product of a distributed, real-time data network. The concept of a "race team" has expanded beyond the physical confines of the garage to become a global, interconnected organism. The Race Support Room is an invisible but decisive player, making every Grand Prix a fascinating case study in high-stakes, remote collaboration. Furthermore, in the cost-cap era, where spending on physical car parts is limited, the ability to interpret data has become the key performance differentiator. Since all teams have access to a similar volume of data and often use common analysis software, the competitive advantage shifts from who can build the most expensive part to who can extract the most intelligent insight from the same pool of data. The war in F1 is now a war of algorithms and data scientists; data is the new battleground.
Section 5: An Evolution in Speed and Safety: A 75-Year Journey in Data
The history of Formula 1 is a story told in numbers. By analyzing data across its 75-year span, two powerful, intertwined narratives emerge: a relentless pursuit of speed, and an even more profound commitment to safety.
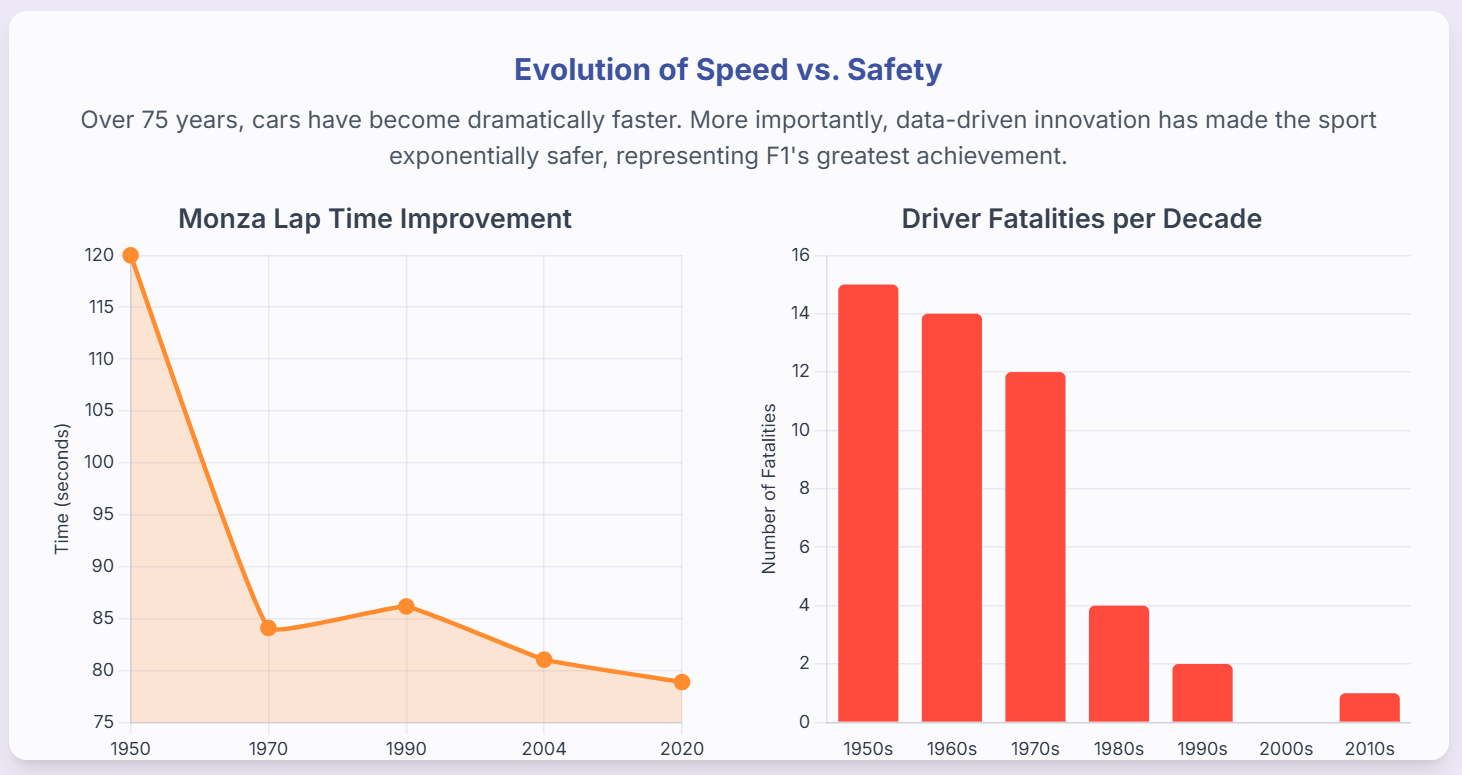
5.1 The Relentless Pursuit of Speed: A Monza Case Study
There is no better place to measure the evolution of F1 speed than the Autodromo Nazionale Monza, the "Temple of Speed." The numbers from this historic circuit tell a clear story of technological progress.
- At the inaugural 1950 Italian Grand Prix, the fastest race lap was set by Juan Manuel Fangio with a time of 2:00.000.
- By 2004, a golden era of V10 engines, the official race lap record had been lowered to a stunning 1:21.046 by Rubens Barrichello in his Ferrari.
- The fastest-ever lap of Monza, and of any F1 circuit in history, was set during qualifying for the 2020 Italian Grand Prix by Lewis Hamilton, who clocked a 1:18.887 at an average speed of 264.36 km/h (164.26 mph).
This represents a staggering improvement of over 41 seconds on a single lap. This quantum leap in performance is the cumulative result of seven decades of innovation in aerodynamics, engine technology, tire compounds, and lightweight materials.
5.2 The Most Important Number: The Drive to Zero Fatalities
While the cars grew faster, the sport's greatest achievement has been making them safer. The early decades of F1 were brutally dangerous, a reality starkly reflected in the fatality statistics. There were 15 driver fatalities during F1 events in the 1950s, 14 in the 1960s, and 12 in the 1970s.
A concerted push for safety, often led by the drivers themselves, began to yield tangible results. Fatalities dropped to 4 in the 1980s and 2 in the 1990s.The tragic deaths of Roland Ratzenberger and Ayrton Senna at the 1994 San Marino Grand Prix served as a powerful catalyst for a new wave of safety reforms. These measures were so effective that the sport went more than 20 years without a driver fatality during a Grand Prix weekend until the death of Jules Bianchi in 2015 from injuries sustained at the 2014 Japanese Grand Prix.
This dramatic improvement is not a coincidence; it is a direct consequence of data-driven safety engineering. The most powerful narrative told by F1's historical numbers is the inverse correlation between speed and danger. As the Monza lap times demonstrate, the cars have become exponentially faster over the decades. Simultaneously, the fatality data shows a dramatic and continuous decrease in driver deaths. Plotting these two trend lines reveals the sport's central paradox and greatest success: the relentless pursuit of speed has been matched, and even surpassed, by a relentless, data-driven pursuit of safety.
Table 3: Timeline of F1 Safety Innovations vs. Driver Fatalities by Decade
Decade | Driver Fatalities (at F1 events) | Key Safety Innovations Introduced |
1950s | 15 | Mandatory helmets (1952) |
1960s | 14 | Roll bars, flag systems, compulsory overalls (1963) |
1970s | 12 | Fire-resistant suits (1975), six-point harnesses |
1980s | 4 | Carbon-fibre monocoque "survival cell" (1981) |
1990s | 2 | Pitlane speed limit (1994), higher cockpit sides (1996), wheel tethers (1999) |
2000s | 0 | HANS (Head and Neck Support) device (2003) |
2010s | 1 | Halo cockpit protection device (trialed, made mandatory 2018) |
5.3 The Pantheon of Greats: Records in Context
The numbers also tell the stories of the sport's greatest legends. Lewis Hamilton stands as the record-holder for the most career wins (105) and pole positions (104), while he and Michael Schumacher share the ultimate accolade of 7 World Drivers' Championships.In terms of longevity, Fernando Alonso is the undisputed king, holding the records for most race starts (411) and total laps driven (22,314).
Among the constructors, Scuderia Ferrari is the most successful and enduring team in history. As the only team to have competed in every season since 1950, it holds the records for most constructors' championships (16), race wins (249), and pole positions (251).
However, these all-time leaderboards must be viewed with context, as records are often a reflection of the era in which they were achieved. For example, Brawn GP holds the record for the highest team win percentage at 47.06%.This is because the team existed for only a single, dominant season in 2009 before being sold. Similarly, comparing Hamilton's 105 wins, achieved in an era of 20+ race seasons, to Juan Manuel Fangio's 24 wins from just 52 starts in the 1950s is a nuanced exercise. The numbers are the starting point for the "Greatest of All Time" debate, but they must be interpreted through the lens of their historical context. Each record tells a story not only about the driver or team, but about the specific era of Formula 1 in which it was set.
Conclusion
Formula 1 is a sport of breathtaking dualities. It is at once a physical contest of human bravery and a cerebral battle of data scientists. It is a global entertainment business built on the foundation of hardcore engineering. The numbers explored in this report illuminate these tensions and reveal a sport defined by relentless, quantifiable progress.
The modern F1 car is a $16 million, 1,000-horsepower testament to the limits of material science and thermodynamics. The driver is a super-athlete, whose body endures forces and physiological stresses that place them at the pinnacle of human performance. The sport itself is a multi-billion dollar global operation, attracting a massive and growing audience through a masterful blend of heritage and modern marketing.
Underpinning all of this is the invisible storm of data. Over a terabyte per car per weekend, analyzed in real-time by hundreds of people across the globe, dictates every strategic move. In the modern, cost-capped era, the ability to turn this data into intelligent action has become the ultimate competitive advantage.
Yet, the most profound story told by the numbers is the one of evolution. Over 75 years, as cars have become unimaginably fast, the sport has become orders of magnitude safer. The inverse correlation between lap times and fatality rates is the sport's greatest achievement—a testament to the fact that its engineering genius has been applied as successfully to protecting its drivers as it has to shattering records. As Formula 1 looks ahead to new regulations in 2026, which promise lighter cars and a greater emphasis on electric power, these foundational numbers will inevitably shift once more, beginning the next chapter in the sport's ongoing, data-driven pursuit of the absolute limit.